Extreme Precipitation: What Does the Climate of Tomorrow Hold?

Header image purchased on Istock.com. Protected by copyright.
Several studies suggest that global warming induced by human activity will also cause an increase in the intensity of extreme precipitation events. However, the great variability of the latter makes it difficult to detect significant increases in the short to medium term. Indeed, it is likely that the detection of an upward trend in some Quebec regions will be delayed until the middle of the 21st century. However, a seemingly absent trend should not be detrimental to the implementation of adaptation measures against climate change.
There is a consensus among scientific studies that global warming is induced by human action through greenhouse gas emissions[1]. In addition, several studies suggest that a warmer atmosphere would store more moisture, causing an increase in the intensity of extreme precipitation events[2,3]. Since extreme precipitation is used as one of the main design criteria for several urban infrastructures, any increase would have significant repercussions.
Detecting a long-term increase (or upward trend) in anthropogenic climate change (i.e. human-induced) in extreme precipitation time series can be an essential step in ensuring that our infrastructures are adapted accordingly. However, the climate’s chaotic nature leads to natural variability that could temporarily mask an increasing trend[4.5]. Thus, the main objective of this study was to assess how natural climate variability affects the ability to detect trends caused by anthropogenic climate change in extreme precipitation series.
To achieve this, climate models were used to simulate the different physical processes generating the climate using a grid covering the entire planet[6] (Figure 1). Projections of greenhouse gas emissions have also been incorporated to assess future trends[7]. In addition, several simulations were run using the same parameters, except for an atmospheric micro-perturbation, similar to the flapping of a butterfly’s wings. Due to the chaotic nature of the climate, the simulations diverged after only a few weeks, resulting in different equiprobable versions of a future climate[8]. This approach makes it possible to better quantify the contribution of natural climate variability in relation to anthropogenic climate change.
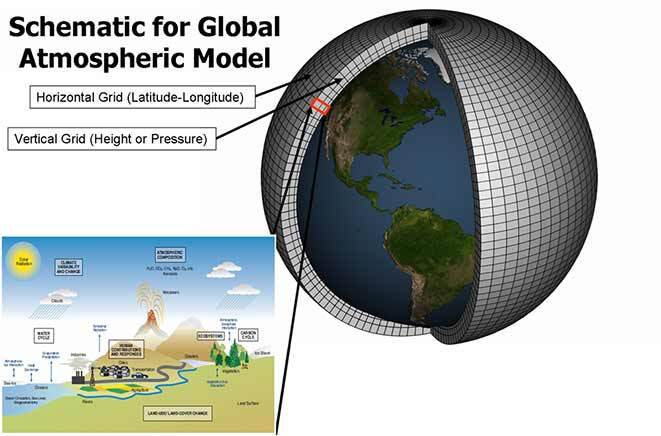
Figure 1 Schematic representation of a climate model.
From NOAA
An ensemble of 50 simulations covering the period from 1950 to 2100 is presented in Figure 2, illustrating how natural variability can mask the trend of climate change. The observed trend of increasing temperatures is stronger (blue curve) than the relatively small natural variability (envelope of the gray curves), which makes it easier to detect a trend even nowadays. However, although a trend is visible by the end of the 21st century for extreme precipitation, this is less pronounced and the variability is greater, making it difficult to detect a short-term trend. It is also expected that this same natural variability will be larger at the local scale (e.g., the city of Montreal) compared to the regional scale (e.g., southern Quebec).
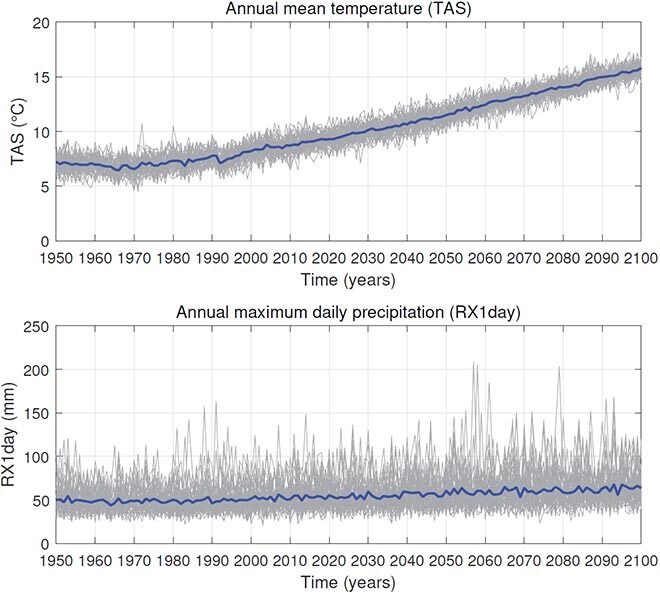
Figure 2 Ensemble of 50 climate simulations for the grid point corresponding to the city of Montreal
In this study, a criterion was developed to determine the decade (e.g., 2041–2050) when it becomes very likely that a trend caused by climate change will be detected. The 1950–2000 period is first analyzed for each of the simulations using a statistical test to determine if a trend is detected in the annual maximum daily precipitation time series[9] (e.g., gray curves in Figure 2). The percentage of simulations with a significant trend of the same direction (increasing or decreasing) is then evaluated. When this percentage reaches 90%, it becomes very likely that a trend will be detected during this decade.
Then, to compare the impact of the local and regional scale, a regional variant of the methodology, using nine grid points rather than just one, was carried out[10]. The regional analysis allows to raise the detection threshold of a statistically significant regional trend from several local series with no statistically significant trend. For example, time series from 9 weather stations could all have upward but statistically insignificant trends. Individually, no conclusion can be drawn from any of these stations. However, the probability of these 9 stations all having an increasing trend is so small that a statistically significant trend at the regional level can be concluded.
The results obtained (Figure 3) indicate that the likelihood of a trend detection at the regional scale will be delayed until the middle of the 21st century due to natural variability in many parts of the world, and particularly in Quebec. In the case of detection at the local scale, the role of natural variability is even greater, possibly delaying potential detection until the end of the century. Thus, to the extent possible, it is recommended to conduct regional rather than local analyses to minimize the effect of natural variability on trend detection.
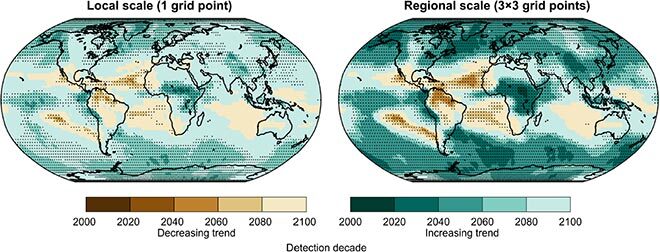
Figure 3 Results at the local and regional scales. The black dots represent the grid points for which the detection decade has been reached
Finally, it is likely that the analysis of one or more weather stations does not show a statistically significant trend. However, a seemingly absent trend should not be detrimental to the implementation of adaptation measures to anthropogenic climate change, as a lack of action could have a significant impact in the medium and long term.
Additional Information
For more information on this research, please refer to the following paper:
Martel, J. L., Mailhot, A., Brissette, F., & Caya, D. (2018). Role of natural climate variability in the detection of anthropogenic climate change signal for mean and extreme precipitation at local and regional scales. Journal of Climate, 31(11), 4241–4263.