Detecting Performance Degradation in Fiber-Optic Cables

Purchased on Istock.com. Copyright.
Fiber-optic cables deployed over the last 30 years are considered long-life components due to the generally high level of reliability of glass and the robustness of manufacturing processes. However, like any component, their performance may degrade over time depending on various factors and environmental conditions. In this paper, three statistical methods were applied to data collected over 12 months on an optical link to detect any increase in optical loss in a section of optical cable (span)—a sign of aging in optical fibers. The method showed an increase of 1.3% in span loss for the period under study. This trend was validated using linear regression over a subsequent 9-month period. Keywords: Optical fiber, optical loss, time series decomposition, long-term trend detection, linear regression.
Introduction
Optical communication systems are the backbone of today’s information and communication society. Several billion kilometres of optical fibers are now installed worldwide—enough to wrap a glass string as thin as a human hair around the globe more than 100,000 times [1]. In fact, fiber optics offer an impressive transmission capacity of approximately 88 Terabits/s—or, by analogy, 88 × 17,000 hours of music [2]—and many other advantages, including long life span. However, this life span is limited by many external factors causing degradation and reducing optical signal performance. These factors include environmental conditions related to locations where the fiber is deployed.
In addition, optical networks are made up of optical fibers of various types, lengths, and generations, some of which have been deployed for more than 30 years and have an estimated life span of 20 to 40 years [3]. As a consequence, operators are working on quantifying the long-term effects of optical fiber aging on performance parameters. Several studies have been carried out over time, but the problem has not yet been solved. Some proposed methods are theoretical; others are rather destructive and intrusive, involving tests on samples of old cable; and still others, rather costly, require the installation of additional equipment.
On the other hand, operators regularly monitor the optical performance of the network, including bit error rate (BER) measured at optical receivers (Rx), and optical power measured at optical amplifiers located at intermediate sites (ROADM sites), in Figure 1 [4]. These data are recorded every 15 minutes and are only used for root cause analysis when component or network failure occurs.
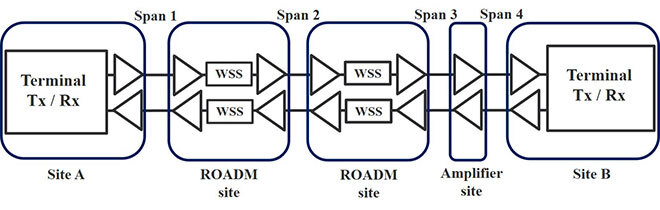
Figure 1 Bidirectional optical circuit under analysis (4 spans of optical fiber, 205 km total length).
WSS: Wavelength Selective Switch; ROADM: Reconfigurable Optical Add-Drop Multiplexer
Detecting Trends
The proposed technique is based on a long-term trend analysis, a subject that has been extensively studied in the fields of meteorology, finance, air and water quality monitoring. It is based on the use of three complementary statistical methods, namely the Seasonal-Trend decomposition using LOESS (STL), the Mann-Kendall test, and Sen’slope methods.
These methods were applied to the loss in each section of optical fiber (span) calculated from optical amplifier power data collected over a 12-month period, in order to quantify the loss related to optical fiber degradation.
The STL decomposition method is first applied to isolate the trend component. Time series include 3 components: a trend component that gives the long-term evolution of the series, a seasonal component that describes seasonality—presence or absence of periodicity—and a residual or noise component, which is what remains of the series when the first two components are removed. The Mann-Kendall test is then applied to determine whether the trend is increasing, decreasing, or non-existent. A growing trend—which, as relates to this paper, indicates that span loss increases with time—is a sign of degradation. Subsequently, the Sen’slope test is a numerical quantification of the rate of degradation.
With this approach, a 0.2-dB increase in optical loss in a section of the optical cable was detected. The linear regression method confirmed this trend over a subsequent 6-month period, with a cumulative slope value of 0.3 dB (Figure 2). Optical loss in the cable segment then peaked at around 13.7 dB.

Figure 2 Evolution of optical loss (span 1, direction A-B) in the first 12 months (black),
and confirmed by additional 12-month data (blue)
Conclusion
In this paper, three complementary statistical tests were conducted on optical loss data in a segment of optical cable to detect potential long-term degradation. The increase in detected optical loss is very small, as expected, given the relatively short observation period. Independent measurements have confirmed that this increase is due to optical fiber performance degradation, and not to metrics or instrument error.
This tool could be useful for optical loss data analysis in optical cables, particularly to locate degrading optical fiber segments. If automated, this method could be used by network operators for fiber monitoring, early detection of fiber cable degradation, and proactive planning of fiber replacement based on historical data.
Additional Information
For more information on this research, please refer to the following paper:
B. L. M. Yaméogo, D. W. Charlton, D. Doucet, C. Desrosiers, M. O. Sullivan, and C. Tremblay, “Trends in Optical Span Loss Detected Using the Time Series Decomposition Method,” Journal of Lightwave Technology, pp. 1-1, 2020.