Assessing Ventilation to Limit the Spread of Microorganisms
Purchased on Istockphoto.com. Copyright.
Ventilation can play a role on virus and bacteria dispersion, especially in the case of less maintained systems. This study focuses on the ÉTS library ventilation systems. To find out their impact on pathogen spread, high and low traffic zones were monitored. A higher airflow rate was applied to verify the impact of ventilation on surface hygiene. To find microorganism concentrations, biochemical measurements of ATP (adenosine 5′ triphosphate) were used. Results indicated that ventilation does not significantly deposit biomass on surfaces. On the other hand, increased traffic resulted in exceeding hygiene monitoring and control indicators. Bacterial flora increased with higher traffic, but ventilation did not impact the measured values.
Microorganisms as Risk Indicators
In the current health context [1], it is essential to ensure cleanliness of spaces and surfaces that could be bacteria and virus vectors. The risk of transmission is multiplied by vectors like ventilation that promote the release of introduced aerosols [2] [3]. Cleanliness of ducts and filters plays a major role. Proper design of heating, ventilation and air conditioning systems can reduce the risk of respiratory illness [4]. The purpose of this exploratory study was to evaluate surface contamination and microorganism concentrations based on measurements of adenosine triphosphate (ATP) concentrations. This method does not detect the presence of viruses. However our work was based on the assumption that high concentrations of microorganisms multiply the risk of viruses being present in areas exposed to transmission [5] [7].
The results will help determine how to maintain and use ventilation systems to better manage contamination risks. Covid-19 is not transmitted mostly by surface , however, cleaning and disinfecting can help limit the presence of viruses [8] [9]. ATP testing is based on bioluminescence, an enzymatic reaction essential to the energy conversion of all living beings [10] (Figure 1). Such testing can be done directly at ÉTS, without deoxyribonucleic acid (DNA) sequencing through a polymerase chain reaction (PCR).
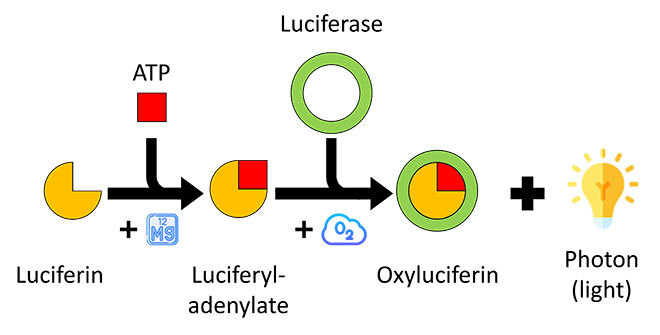
Figure 1: Principle of ATP testing
Measuring Instruments and Sampled Areas
An anemometer“An anemometer is an instrument that measures wind speed and wind pressure.“Ref. The National Geographic Society was used to measure ambient conditions. To record airflow in the spaces, the centralized technical management system (CTM) at ÉTS was used along with measurements obtained with a balometer“… a balometer is a device used for measuring the volume of air coming out of grilles and diffusers in HVAC systems.“Ref. Askinglot. A CO2 analyzer and a roughness meter“Roughness meters, also called surface roughness meters, are instruments that measure the smoothness (degree of roughness) of the surface of a target”Ref. Keyence were also used to measure air quality and because of the dependence of hygiene measures on surface roughness. Surface hygiene conditions were measured using kits provided by GL Biocontrol. These test measurements were compared to monitoring and control thresholds to ensure that the health measures are adequate in the present health context. The thresholds were based on those defined in a European report (Biowyse) and aim to control the rate of surface contamination. The equipment used for the study is presented in Figure 2.
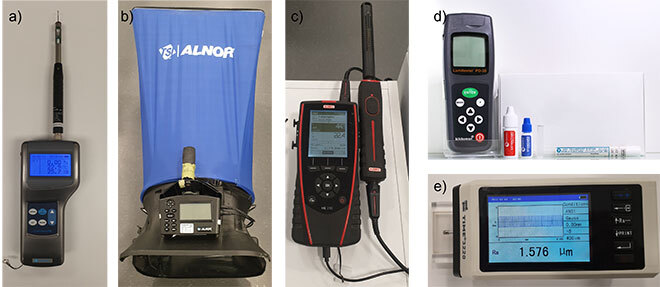
Figure 2: Equipment used to monitor indoor conditions and surface hygiene.
a) anemometer; b) balometer; c) CO2 analyzer; d) ATP measurement kit; e) roughness meter.
The measurements were performed in two areas of the ÉTS library, one with high traffic levels and the other with no traffic (Figure 3). Three zones were monitored in the no-traffic area to obtain better repeatability and spatial representativeness; only one zone in the high-traffic area was monitored to evaluate the impact of high traffic. The measurements were taken during one week in August and another in November. First, the week in August provided reference conditions in situations of low traffic and allowed us to carry out a ventilation flow test consisting of increasing the airflow to evaluate filter clogging. By increasing the flow rate, we wanted to create a pressure increase on both sides of the filter. If the filter is clogged, air flow will be poor, which can lead to overpressure in the filters and in the ventilation duct. Overpressure in the ventilation system should give an indication of clogging through the release of additional particles or an abnormal flow variation. In addition, clogged filters can cause an increase in the system’s energy consumption. Secondly, monitoring in the week in November allowed us to observe the library in high traffic conditions.
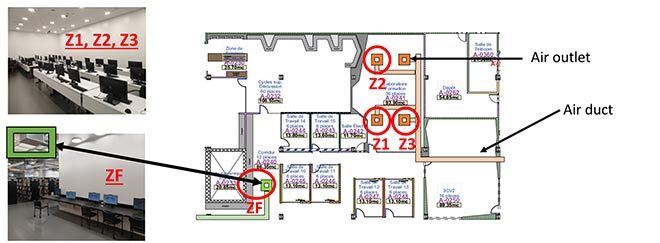
Figure 3: High traffic (ZF) and low traffic zones (Z1, Z2, and Z3) at the ÉTS library.
Results
During the target week in August, street work was in progress near the ÉTS library (Figure 4). The work was completed by mid-week and we conducted a ventilation test by increasing the airflow rate to a maximum. The measured flow rates are presented in Figure 5. During the test, the flow values were outside the CTM range and could not provide reliable information. However, measurements with the balometer allowed to validate the test conditions.
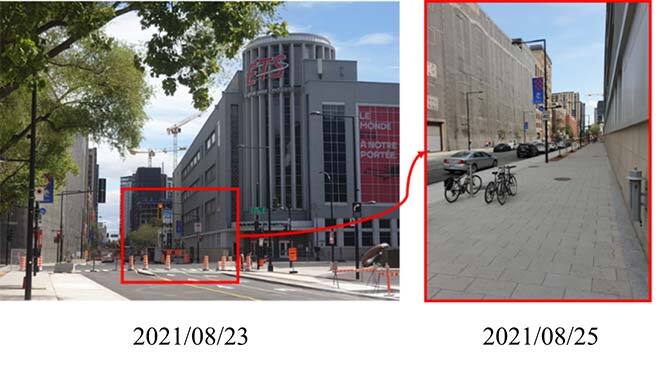
Figure 4: Street work during the week of August.
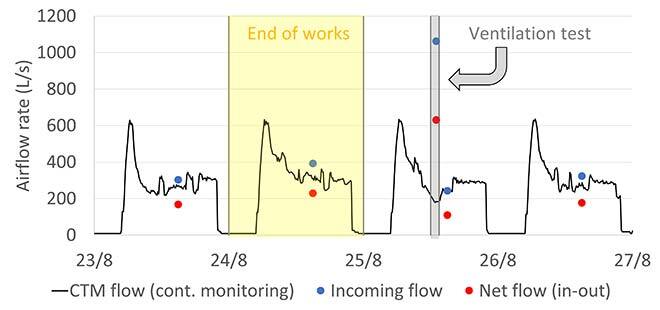
Figure 5: Measurements of ambient conditions in the low traffic zone during the week of August.
Figure 6 shows the hygiene measurement results with the library’s traffic level. The results were compared to monitoring and control thresholds, based on levels validated in Europe, but not yet implemented in Canada. Thresholds are generally defined for specific bacteria [11] and are used here as a guide. Monitoring and control thresholds indicate if the zones under study should be monitored more regularly, or if corrective action must be taken. These threshold levels can be defined in accordance with agri-food standards, which are very strict since they concern surfaces directly in contact with food products (monitoring: 0.5 pg/cm 2; control = 1 pg/cm 2) or with conditions required in the aerospace sector, as in the Biowyse project (monitoring: 3 pg/cm 2; control: 10 pg/cm 2) [12]. In school settings, no threshold has yet been defined.
In the monitored zones, surface roughness measurements (10 measures for Z1, Z2, Z3, ZF) were similar: in low traffic zone, an average value of 2,1 µm (σ = 0.41) and in high traffic zone rugosity was evaluated to 1.6 µm (σ = 0.24). In August, ventilation flow tests and street work did not appear to increase surface biomass levels in the monitored zones. As expected, higher ATP concentrations were recorded during the week in November, in keeping with higher library traffic. This highlights the importance of following protective procedures and public health recommendations in confined areas with heavy traffic. In conclusion, a change in usage conditions of the ventilation system (higher airflow) does not necessarily modify surface bacterial flora concentrations, which means that the systems are adequately maintained. Moreover, biomass deposits in the monitored spaces were mainly due to library traffic. During periods of high traffic, it would be wise to increase air renewal of the areas to dilute aerosol concentrations, which tend to increase with traffic levels, but care must be taken to ensure that the ventilation does not result in the release of viral aerosols [13] [14].
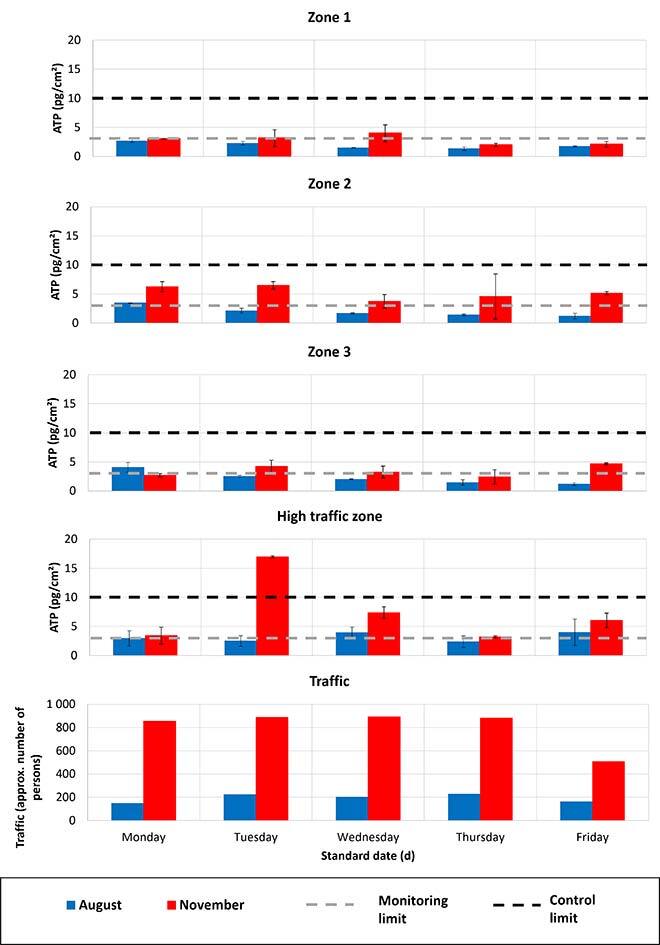
Figure 6: Measurements of hygiene conditions and traffic during the weeks of August and November.
The defined thresholds are given as an indication and correspond to the aerospace sector.
Conclusion
This study was based on ATP testing as an indicator of space hygiene. The test was based on bioluminescence, a fast, reliable and low-cost approach. Results showed that biomass deposits on surfaces were mainly due to traffic levels in ÉTS library areas. Furthermore, during winter pre-exam period, ÉTS was much more frequented than during the summer period, which lead to an increase in ATP concentrations. Frequent surface cleaning and disinfection can help limit community transmission of bacteria and viruses during high traffic periods. Providing cleaning equipment to students, as applied at ÉTS, is therefore effective in limiting the risks of transmission. During these periods, it can also be interesting to limit air recirculation or increase dilution to reduce concentrations of airborne microorganisms. The measurements obtained show that ventilation causes little to no biomass deposit on surfaces: ATP levels did not increase during the week of August, even after the flow test. Thus, maintenance conditions are met, the ventilation system limits biomass deposits in the monitored areas in the low traffic period. This study highlights the fact that ÉTS ventilation systems are well maintained. A specific study of the COVID-19 virus and its variants requires genetic analyses. Finally, a contamination simulation, with aerosols containing particles of similar sizes to COVID-19 and without any health risks, could determine the impact of ventilation on COVID-19 dispersion in confined spaces. In addition, this study highlights the need to define specific monitoring and control thresholds for school facilities.
Acknowledgments
We wish to thank the Mitacs Covid program and Tecnea Canada for their support in this study, and the ÉTS Program in Continuous Improvement as well as the ÉTS staff for their collaboration. We also wish to thank GL Biocontrol for their technical advice.