Climate Change Prospects of a Dynamic City of the Future

Purchased from Gettyimages. Copyright.
Urban Metabolism and Carbon Footprint
Like the metabolism of a living organism, urban metabolism refers to the energy and materials flowing into, within, and out of a city. Throughout their supply chains, these resources are linked to direct and indirect greenhouse gas emissions (Figure 1).
Efforts to mitigate and adapt to climate change were addressed in numerous global fora, including the recent COP27 in Egypt. The earlier COP21 in France, 2015, resulted in the ratification of “The Paris Agreement,” which aims to limit global temperature increases to 1.5 °C. By 2030, the average contribution would need to be no more than 2.9 tonnes CO2-equivalent per person per year, globally.
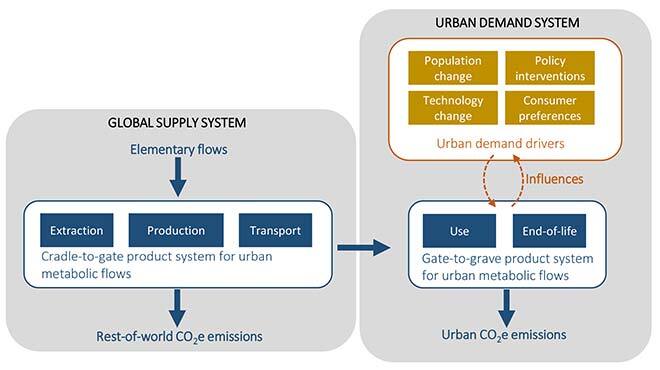
Figure 1. Modelling framework in which urban demand drives global changes. Blue represents the physical flows. Orange represents socio-economic flows. Dashed lines represent coupling between human and nature systems (Elliot and Levasseur, 2022).
Illustrated using a case study in Montreal (Canada), we simulated the urban carbon footprint between 2018 and 2030 under a variety of scenarios, including a baseline case and a case of increasing adoption of plant-based diets. The latter is an application of “socio-ecological contagion,” which refers to a peer-to-peer spread of environmental stewardship. By simultaneously modelling Montreal’s population growth, the greenhouse gas emissions (GHGs) per capita trend was compared to the anticipated 2030 global threshold of 2.9 t CO2e per person needed to meet the 1.5 °C Paris Agreement target.
Food and Materials More Important than Energy
In 2018, Montreal’s urban metabolism had a carbon footprint of 30.4 Mt CO2e total emissions. Subject to the baseline case, Montreal is estimated to reach a carbon footprint of 30.9 Mt CO2e by 2030 in spite of several electrification strategies in transport and building energy. Food is anticipated to generate a large portion of Montreal’s GHGs in 2030, increasing from past years in absolute and relative terms. Absolute reductions are anticipated in the commercial/institutional sectors due to electrification, although, by 2030, the effect of electrification policies on the whole carbon metabolism is outweighed by growth in other urban activities. Meanwhile, activities whose demands are less elastic (food, water, construction) and activities whose impacts are not influenced by Montreal’s electrification plans, are expected to be relatively stable and therefore increase their share of locally generated emissions. Over the forecast period, the carbon footprint is mostly steady, while the portion of emissions occurring within the city is expected to decrease from 25% to 20% by 2030. This decrease in local emissions is largely due to the electrification of transport and building energy over the coming years as urban combustion of fossil fuel activities slowly switch to non-local electricity generation.
Table 1. Baseline results for GHGs by type of sector for 2018 and 2030 (Elliot and Levasseur, 2022).

Montreal far from 1.5 °C Threshold by 2030
In 2018, Montreal’s population generated around 15 tonnes CO2e per person, and the projection of both GHGs and population lead to 12.7 tonnes per person in 2030, yet it is still more than four times the maximum 2.9 tonnes CO2e per person required to meet the 1.5 °C warming limit. Results from this baseline scenario show that by 2030 an increasing portion of Montreal’s carbon footprint is associated with remote activities, and most of that was linked to food and materials consumed in the city. We anticipate the GHGs from food alone in 2030 equates to 3.9 tonnes CO2e/capita. Therefore, it is of paramount importance to address indirect GHGs when considering the urban carbon footprint if we expect cities to contribute to limiting global anthropogenic GHGs. Based on the average GHG allowance per capita in 2030 required to reach the 1.5 °C warming limit, Montreal needs to reach 7.0 Mt CO2e/year by 2030 – a 77% reduction from the projected value of 30.9.
Table 2. Thresholds for global GHG limits compared to Montreal’s baseline scenario to 2030 (Elliot and Levasseur, 2022).

The plant-based-diet scenario results in a downward shift to 26.2 Mt CO2e in 2030, of which 23.6% is expected to occur within Montreal (Figure 2).
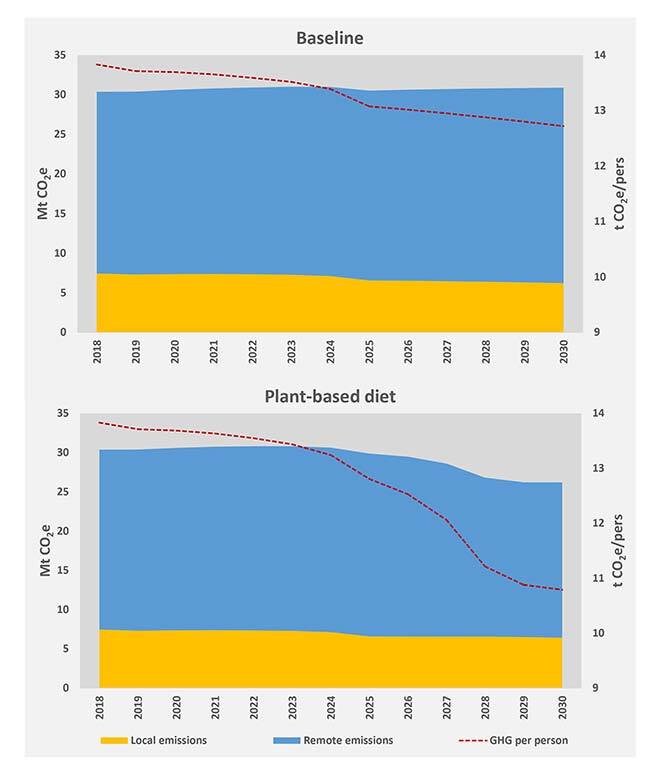
Figure 2. Local and remote greenhouse gas emissions associated with the dynamic urban metabolism of Montreal simulated between 2018 and 2030 for baseline and plant-based diet scenarios (Elliot and Levasseur, 2022).
Montreal’s per capita emissions decrease from 15.0 t CO2e in 2018 to 12.7 t CO2e by 2030 under the baseline scenario; a 9.8 t CO2e/capita overshoot from the 2.9 t CO2e/capita required to meet the 1.5 °C Paris Agreement. The plant-based diet scenario is estimated to reduce to 10.8 tonnes CO2e/capita by 2030. This remains 7.9 t CO2e/capita over the Paris Agreement target for 1.5 °C global warming.
Mainstreaming the Plant-Based Diet
Mainstreaming plant-based diets is expected to result in decreasing Montreal’s carbon footprint over the next decade. In order to foster social acceptance, barriers should be removed from low-carbon consumer decisions, such as making plant-based food choices available. Nudging can induce socio-ecological contagion, lowering future diet-related GHG emissions in cities. Regardless of the approach taken, within the framework of the 2015 Paris Agreement urban metabolic systems are important foci for GHG reduction strategies and some (if not all) of the GHG-intensive urban metabolic flows.
Conclusions
Simulations indicate decreased per capita emissions from 15.0 tonnes CO2e/capita in 2018, in part due to the increasing urban population. The baseline scenario estimates a decrease to 12.7 t CO2e by 2030; the plant-based diet scenario is predicted to reduce GHGs to 10.8 tonnes CO2e/capita by 2030, but this is still 7.9 tonnes CO2e/capita over the Paris Agreement target for a 1.5 °C global warming.
More work is needed to shift urban policy design from local to global in consideration of the globalized supply chains required to meet the demands of city dwellers. Facilitating change to the city’s food-related carbon footprint through socio-ecological contagion is shown to be valuable. Notwithstanding, much more GHG reduction is needed to meet that 1.5 °C per capita goal by 2030. While this example explores the potential for food choices to reduce a city’s carbon footprint, many other sectors could be modelled in this way, such as socio-ecological contagion of transport modes for commuting.
Additional Information
For more details on the subject, please see the following articles:
Elliot, T., & Levasseur, A. (2022). System dynamics life cycle-based carbon model for consumption changes in urban metabolism. Ecological Modelling, 473, 110010.
Elliot, T. (2022). Socio-ecological contagion in Veganville. Ecological Complexity, 51, 101015