November 16, 2026
Understanding falls in bouldering
In bouldering, climbers climb without ropes and can fall several meters — up to 4.5 m under studied conditions. These falls can result in injuries, especially to the lower limbs [1,2]. Crash pads are designed to cushion impacts, but their characteristics can influence landing conditions [3,4]. To better understand these injuries, what happens during a fall must be measured: body movements, landing speed, and accelerations.
Traditional motion analysis systems use markers placed on the body; this is impractical in a climbing gym. Accelerometers attached to athletes measure high-frequency accelerations, but only where they have been placed. Another option is to use multiple cameras for a 3D reconstruction of body movements. This method allows observing the entire body and its trajectory without attaching markers to the climbers [5,6].
Our study evaluates the method without markers to analyze fall height, maximum velocity, and accelerations of different body parts during falls in bouldering.
A device installed directly in a climbing gym
The study involved 10 climbers aged 14 to 17. Forty trials were analyzed: 12 natural falls and 28 controlled jumps.
Five GoPro HERO12 Black cameras recorded the movements at 240 frames per second. Three accelerometers, placed on the right ankle, sacrum, and forehead, recorded accelerations at 1,600 Hz.
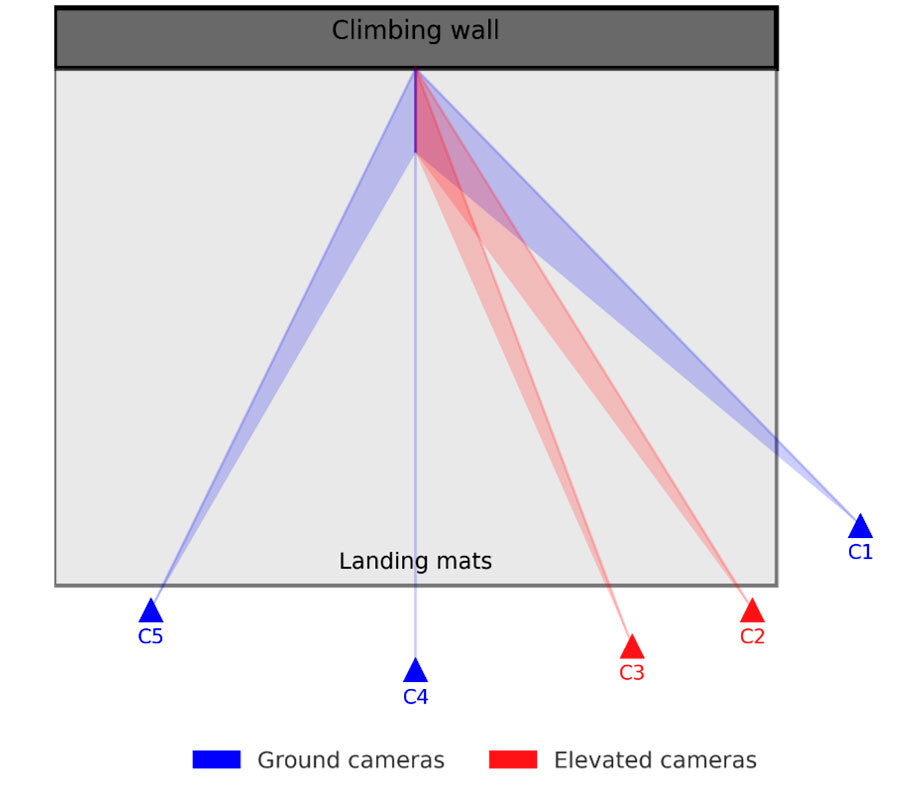
Figure 1 Camera configuration and visual range coverage in the bouldering gym (blue = floor; red = 5 m-raised area).
Comparing two ways to measure a fall
The movements reconstructed from the camera footage were compared to a reference video analysis to verify fall heights and speeds [7,8]. The accelerations measured by the cameras were also compared with those recorded by accelerometers attached to the athletes.
An accurate reconstruction of overall movement
The drop height and maximum vertical velocity were accurately reproduced relative to the reference video analysis. The average deviations ranged from −3.4% to −0.2% for height and from −2.3% to +2.5% for velocity.
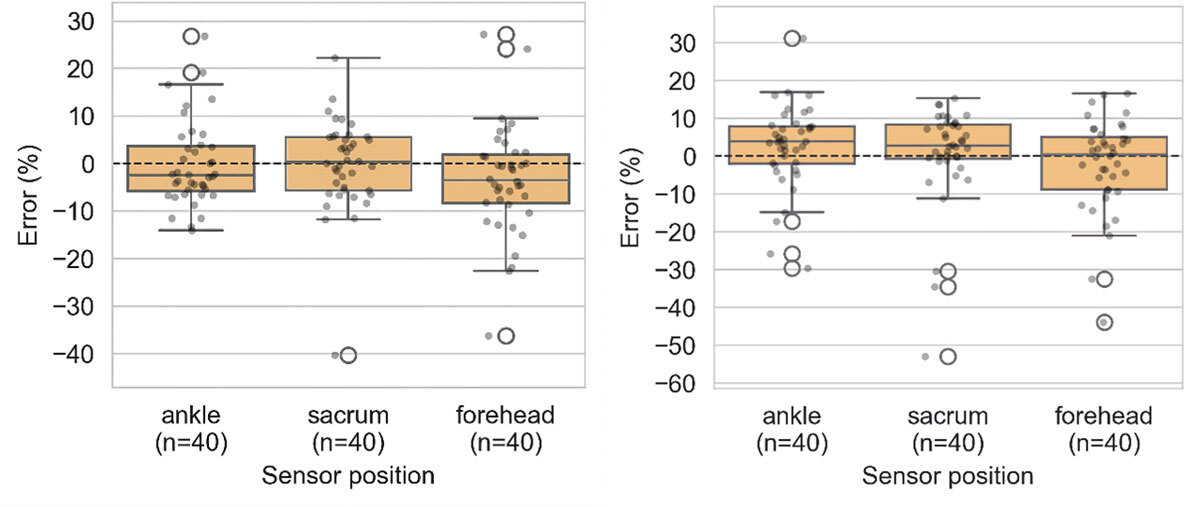
Figure 2 Relative error (%) of fall height and vertical velocity estimates obtained from the 3D reconstruction method, compared with the reference video analysis at the ankle, sacrum, and forehead (n = 40). Box plots show the interquartile range and median; whiskers indicate non-outlier extreme values; dots represent individual trials; and open circles indicate outliers. The dashed line represents zero error.
A challenge in measuring peak accelerations
Results differ for maximum accelerations. At the ankle, accelerometers measured an average of 198.1 m/s², compared to 133.2 m/s² with the cameras. At the sacrum, the values were 100.4 m/s² with sensors and 56.6 m/s² with cameras, respectively. At the forehead, the two methods yielded values that were closer to one another.
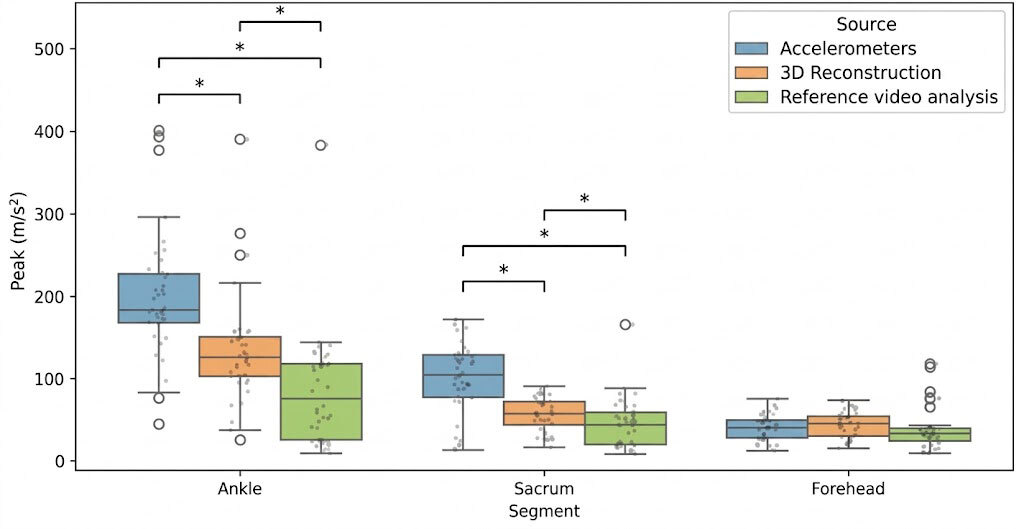
Figure 3 Acceleration peaks measured by 3D reconstruction, reference video analysis, and accelerometers at the ankle, sacrum, and forehead. Box plots show the median, interquartile range, and non-outlier extreme values. Dots represent individual trials, and open circles represent outliers. Asterisks indicate significant differences (* p < 0.05).
Video and accelerometers: Two complementary methods
These results show that video reconstruction accurately captures the overall motion of falls. Height, speed, and general trajectories of the body are reproduced correctly without using markers.
Acceleration peaks, however, are more difficult to measure, especially at the ankle and sacrum. Accelerations are much higher at these locations than at the forehead, which can make the peaks harder to reproduce from video data. Acceleration calculations and filtering can also reduce their amplitude. Figure 4 illustrates the challenges of tracking during impact, especially when the ankle sinks into the mat and the body deforms. Rotations and self-occlusions also complicate tracking, while the lack of 360° coverage – because of the wall – can exacerbate these issues.
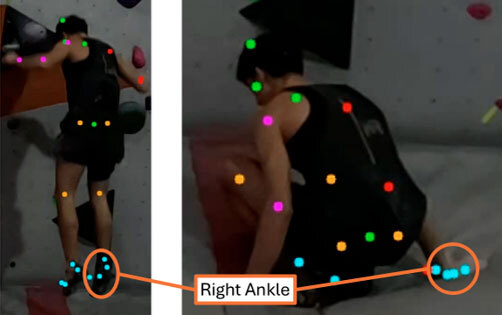
Figure 4 Comparing estimation quality of foot placement during a bouldering fall. (Left) Mid-air phase with good joint detection. (Right) Impact phase showing tracking issues when the ankle sinks into the mat, and the body deforms. Coloured dots represent the detected anatomical landmarks.
Both approaches are therefore complementary: video captures overall motion, while accelerometers are better suited when measuring rapid impacts.
Toward a better analysis of falls in bouldering
This study shows that a 3D reconstruction method using multiple cameras efficiently captures fall motions in bouldering. It accurately reproduces the height and speed of falls, while allowing researchers to observe trajectory and body movements without attaching markers to the climbers.
However, this method has limitations when measuring peak acceleration at impact, specifically at the ankle and sacrum. Therefore, under the studied conditions, accelerometers still complement video data in characterizing impact intensity. Combining the two approaches could provide a more comprehensive description of fall dynamics.
References
[1] Müller, M.; Heck, J.; Pflüger, P.; Greve, F.; Biberthaler, P.; Crönlein, M. Characteristics of bouldering injuries based on 430 patients presented to an urban emergency department. Injury, 2022, 53(4), 1394–1400. https://doi.org/10.1016/j.injury.2022.02.003.
[2] Auer, J.; Schöffl, V.R.; Achenbach, L.; Meffert, R.H.; Fehske, K. Indoor Bouldering—A Prospective Injury Evaluation. Wilderness & Environmental Medicine, 2021, 32(2), 160–167. https://doi.org/10.1016/j.wem.2021.02.002.
[3] Beurienne, E.; Dorsemaine, M.; Bruna-Rosso, C.; Wylomanski, M.; Bailly, N.; Behr, M. Designing safer climbing pads: The role of foam, covers, and trapped air in pad performance. Results in Engineering, 2025, 28, 107218. https://doi.org/10.1016/j.rineng.2025.107218.
[4] Schwanitz, S.; Kohout, N.; Krumm, D.; Odenwald, S. Impact loads when jumping on indoor climbing mats. Proceedings of the 15th International Conference on the Engineering of Sport, 2024. https://doi.org/10.17028/rd.lboro.27052576.v1.
[5] Pagnon, D.; Domalain, M.; Réveret, L. Pose2Sim: An End-to-End Workflow for 3D Markerless Sports Kinematics—Part 1: Robustness. Sensors, 2021, 21(19), 6530. https://doi.org/10.3390/s21196530.
[6] Pagnon, D.; Domalain, M.; Réveret, L. Pose2Sim: An End-to-End Workflow for 3D Markerless Sports Kinematics—Part 2: Accuracy. Sensors, 2022, 22(7), 2712. https://doi.org/10.3390/s22072712.
[7] Puig-Diví, A.; Escalona-Marfil, C.; Padullés-Riu, J.M.; Busquets, A.; Padullés-Chando, X.; Marcos-Rodríguez, P. Validity and reliability of the Kinovea program in obtaining angles and distances using coordinates in 4 perspectives. PLOS ONE, 2019, 14(6), e0216448. https://doi.org/10.1371/journal.pone.0216448.
[8] Fernández-González, P.; Koutsou, A.; Cuesta-Gómez, A.; Carratalá-Tejada, M.; Miangolarra-Page, J.C.; Molina-Rueda, F. Reliability of Kinovea® Software and Agreement with a Three-Dimensional Motion System for Gait Analysis in Healthy Subjects. Sensors, 2020, 20(11), 3154. https://doi.org/10.3390/s20113154.